A chart that explains almost everything!
Interpret any ICO / IDO terms and tokenomics of a project visually by using our super "easy to read" charts
5x
cheaper than competitors
100%
customer satisfaction
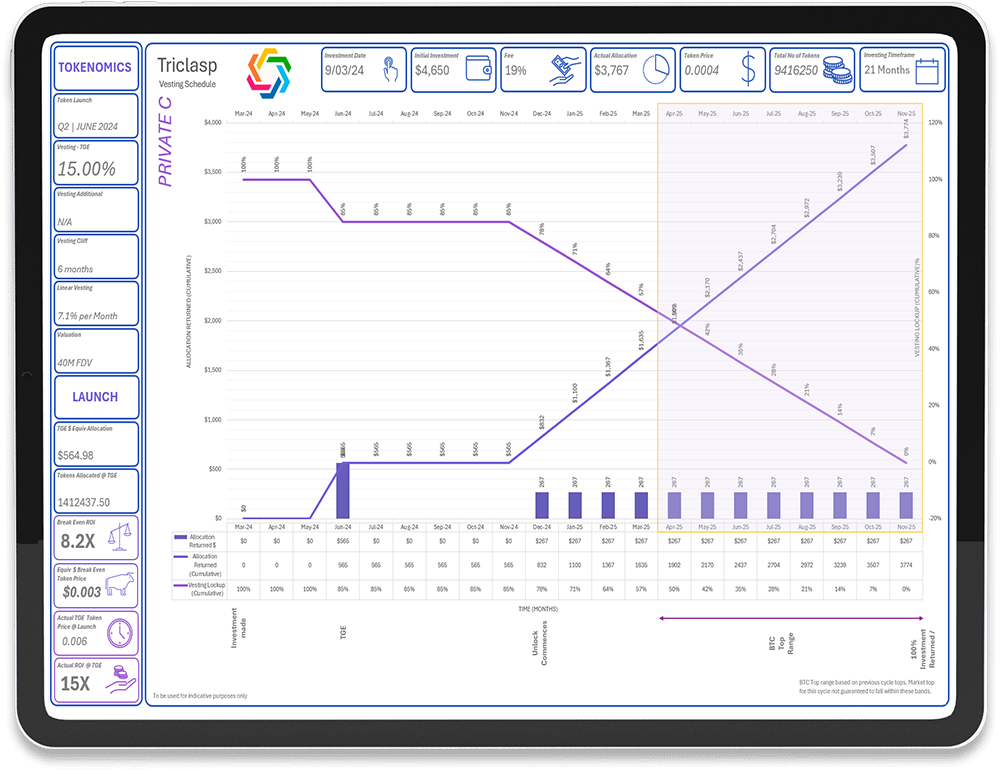
Interpret any ICO / IDO terms and tokenomics of a project visually by using our super "easy to read" charts
cheaper than competitors
customer satisfaction

Token Generation Events, Cliffs, Allocations, Vesting Schedules
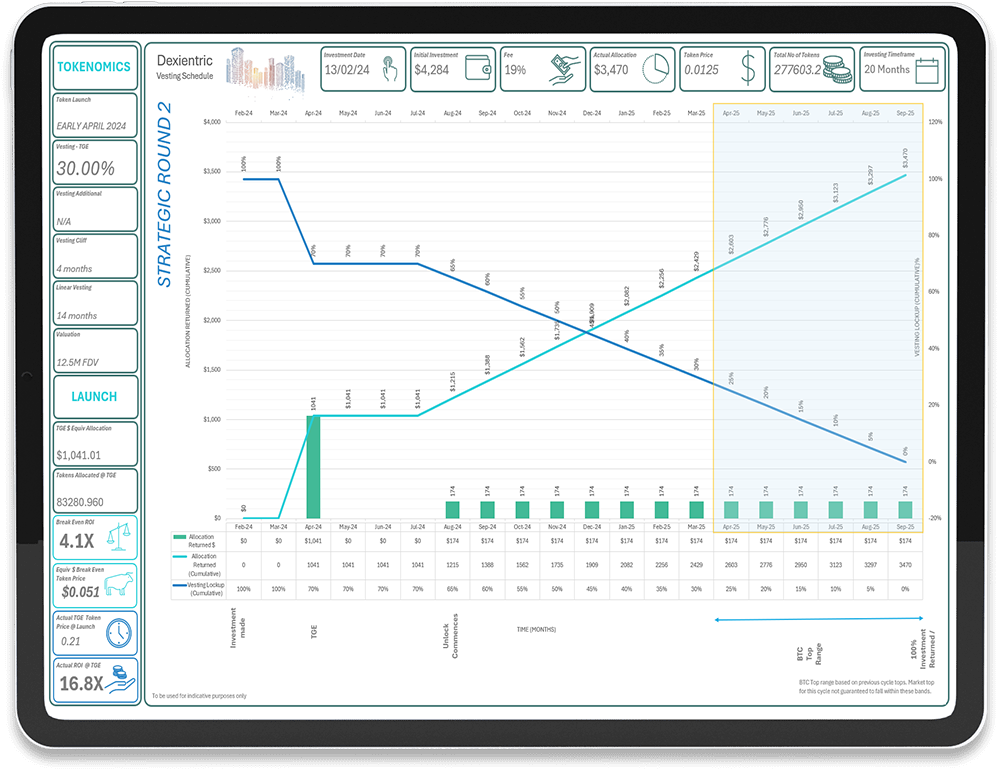
See all important Tokenomics and information of an investment project clearly and easily on one chart.
Actual ROI and equivalent Break Even points show speicifc metrics of how and what your investment has done / has to do.
Easily see distributions / allocations of the Target Generation Event (TGE) and vesting in both dollar value and token quantity.
See overall investment timeline from the date of investment, through the TGE, Cliff and Vesting dates to the final vest.
Seeing your investment on a time series chart illustrates data points over successive intervals of time
Each point on the graph corresponds to both a time and quantity that is being measured


Our charts are developed in a way to be easily interpreted and come in a variety of colour schemes. Line and bar charts have defining colours that can be easily distinguished from each other.
Values are indicated on charts visually, as well as collated in a data table.
Additional indicative information shown such as Top of Cycle Window, Break Even ROI and $ / Token allocations.
Get all the specific details of your investment in one chart for a little over the cost of a couple of coffees!

Have all the Tokenomics and Vestonomics displayed in one place

We'll send you your completed chart within 24hrs of payment of funds
Our pricing for each chart is $15USD. A little over the cost of a couple of coffees

Targeted to investors who are relatively new to the crypto sphere or are new to presales / ICO investments, these charts allow you to easily visualise the values, dates, durations and overall timeline that an investment project is being offered under. Although the chart delves deeper into metrics and ROI's, it also provides the basic details that everyone starting out in the space is needing to know:
What the Token Generation Event (TGE) distribution is in $ and in Token Qty, and further provides pricing and quantities for each vesting allocation until totally vested.
Simply fill in the user fields on the checkout page to advise us of the specifics of your invested project. An easy to use payment gateway to pay in either Fiat or Crypto
This is the stage where we will take the information you have provided and update the source sheet. Additional project details and icons to be sourced.
Once we have completed your vesting chart from the information that you have provided, we will email it directly to you.
Ivendpay gateway for simple crypto payments.
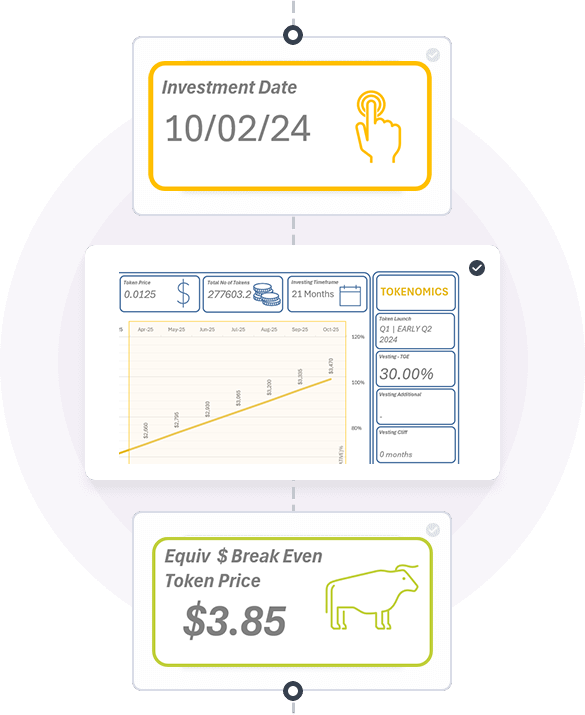
Some of the information you will see in the chart
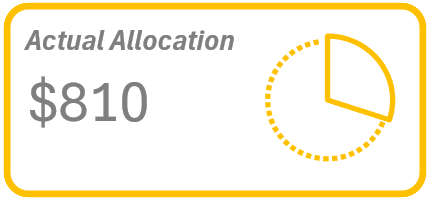
Easily see the Actual Allocation Value after Launchpad fees / commissions
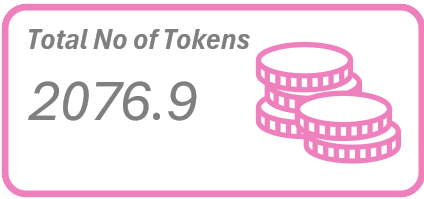
The number of tokens are calculated from the offer price and the funds initially invested.
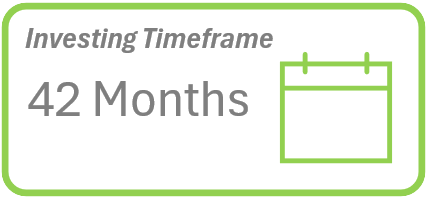
Provides a clear investment window from initially placing funds to final vest date.
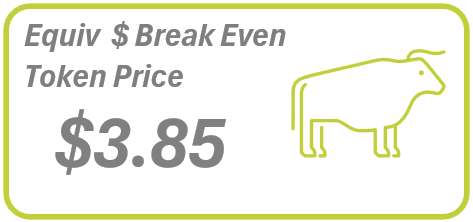
Calculates the Break Even price of investment at TGE based on the allocated TGE distribution
Calculates the Return on Investment at the Token Generation Event as a Multiplier and as $ value.
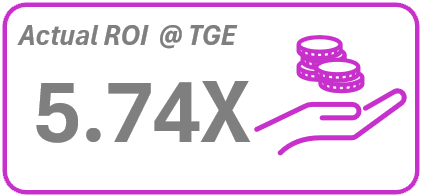
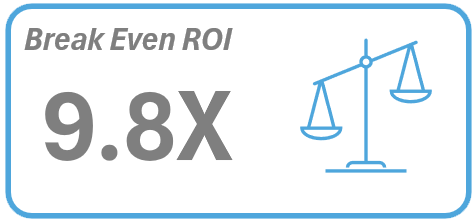
Calculates the actual Break Even Multiplier and $ value at the Token Generation Event
Act now to see all the important vestonomics of your investment visually presented in a clear and easy to read format
Ivendpay gateway for simple crypto payments.

